Mapping the UK’s development NGOs: income, geography and contributions to international development
Nicola Banks, Dan Brockington
Abstract
Using a unique database of the incomes, expenditures and geographic location of 895 British-based development nongovernmental organisations (NGOs) spending more than £10,000 in 2015, we show that the contribution of development NGOs has been substantially underestimated. In 2015, Britain’s development NGO sector spent nearly £7 billion, equivalent to over half the UK government’s official development assistance (ODA) that year. Until now, data have not been compiled that allow the strength and significance of the sector, or its structural composition, to be understood.
Mapping the sector in this manner reveals four original and important findings:
- the size and significance of the sector, and the implications of this for our understanding of Britain’s foreign aid contributions;
- that giving to international development causes is relatively minor in comparison with overall charitable giving, and appears insulated from financial crisis;
- the extent of sectoral unevenness in expenditure and its stability; and
- the increasing intermediation of funds within the sector as a result of changes in the funding landscape.
This provides new insight into an influential sector, and highlights the importance of innovative research methods and techniques for the systematic understanding of development NGOs globally.
Keywords
Development NGOs, overseas charities, ODA, charitable funding
View/Download options
You will need a PDF reader such as Adobe Acrobat (downloadable from Adobe) to view PDF file(s). PDF files open in a new window.
Read the article in full below.
1. Introduction
Research on the work of development nongovernmental organisations (NGOs) is afflicted by a curious paradox: it is voluminous, but it is also oddly inadequate. NGO research has spawned a diverse literature that purports to cover the work of thousands of organisations working across several continents and multiple areas of interest. Yet, for all that interest, we need to do far more, and use innovative research methods, if we are properly to understand the work of the sector. Research on development NGOs has rarely been systematic. It has largely been piecemeal, focusing on individual organisations or small collectives (commonly concentrating on the largest organisations). It has not examined sufficiently how development NGO sectors are structured or how they operate as a whole.
The new methods we apply here, including the construction of a unique database, provide the rigour required to produce significant and original findings on the structure, networks, organisation, reach and funding dynamics of development NGOs as a whole. By tackling methodological gaps in the existing literature we show that the financial contribution of NGOs to international development is more significant than has been recognised to date. Development NGOs based in the UK are spending more money, and reaching more people, than has been acknowledged. Indeed, their contributions exceed the aid budget of several wealthy countries.
Far more than the mere size of the sector this approach also helps us to understand:
- how the sector’s total expenditure compares with sources of development finance, such as official development assistance;
- the structure of the sector, the networks through which it operates, and the way in which both affect interactions between NGOs;
- trends in size and growth, the influence of fundraising strategies and changes in funding modalities or policies on the sector’s health and influence;
- the variety of its interests and the relative importance of different development foci for the sector as a whole (education, health, gender equality, etc);
- the public legitimacy and political power of development interests as expressed in support for development NGOs;
- the geographical reach and focus of international NGOs based in particular countries;
- their role in fostering and channelling concern within the UK for distant strangers in the Global South.
Put another way, failing to adopt a systematic sectoral approach could mean that research continues to underestimate substantial aspects of the contribution and significance of the work of development NGOs. In the absence of sectoral overviews, it is difficult for policies based on development NGOs or their work to be evidence-based.
The purpose of this paper is thus to demonstrate the power and insights that are afforded by taking a systematic approach to understanding the work of development NGOs. We have created a database of 895 such organisations based in Britain spending more than £10,000 annually.1 We have used this to explore some of the elements mentioned above – namely the size and structure of the sector, trends in its growth between 2009 and 2015, and its basic geography.
On the basis of this work we find that British-based development NGOs are a much more significant force in development spending and foreign aid than is currently recognised. Critics of development NGOs may well view this with alarm, given that development NGO interventions may have problematic outcomes; a critical perspective on and assessment of what they do remains necessary. But our point is that, whether NGOs’ contributions are to be welcomed, questioned or deplored, we must first have a better understanding of their number, organisation, networks and the extent of their influence.
We also argue that there are significant challenges and conundrums in understanding growth and change in the sector, including the increasing role of the intermediation of funds within Britain’s development NGO sector itself. That is to say, changes in funding modalities mean that money is going through multiple UK development NGOs before reaching their Southern partners and beneficiaries. Commonly intermediation in the aid chain is conceptualised along the Global North–South divide, with international NGOs acting as intermediaries between donors and their Southern partners or beneficiaries. Our findings reveal growing complexity here, with increasing intermediation – and additional actors in the aid chain – among UK development NGOs themselves, before these funds and projects reach global partners. These changes only become apparent when taking this systematic approach; they are particularly important to explore seriously and rigorously in an era of growing nationalism, parochialism, austerity and apparently declining support for development causes in the Global North. Finally, we contend that, by compiling such systematic databases, and sharing them effectively, we allow a much richer and broader research agenda into the work of development NGOs to emerge.
We proceed as follows. In the following section we examine how a greater sectoral approach to researching development NGOs would enhance understanding across the Global North and South. Section 3 then situates the study and introduces our research methodology. Section 4 presents key findings from our mapping project, before Section 5 discusses what this means for existing knowledge on development NGOs in the foreign aid system. Section 6 concludes.
2. Researching development NGOs: where we are to date 2
Academic research into NGOs began in the late 1980s with the publication of a World Development special issue on NGOs as development alternatives (Drabek, 1987). Yet, while long-standing actors in international development, it was not until the late 1990s that NGOs were increasingly recognised as a ‘sector’. This was not just a case of their increasing organisational density, but of achieving cognitive recognition and legitimacy in the minds of the public (Marburg et al, 2016). Their importance as development stakeholders rose alongside the amount of money they raised and spent internationally. Atkinson et al (2012) show that annual donations to a panel of 56 UK-based development charities increased sixfold, from £116 million to £683 million, between 1978 and 2004, outpacing rises in household income and growing much faster than the 1.5 factor growth in ODA over the same period.
Despite the increasing recognition and importance of development NGOs as a sector, research itself has been surprisingly slow (or unable) to undertake systematic analyses from a sectoral perspective. Here we outline three ways in which NGOs have been researched collectively: by defining or theorising about development NGOs; through situated explorations of their activities by country or sector of operation; and by analysing partnerships between development NGOs in the North and South. Apparent across all three of these dimensions is a lack of any systematic analysis of NGOs at the sectoral level, leaving us dependent on assumptions and generalisations in our understanding of development NGO sectors, their overall contributions and how they operate.
2.1. Theorising NGOs, what they do and how they do it
One long-standing theme has been attempts to define and theorise NGOs and civil society organisations, designing typologies and exploring their comparative advantages vis-à-vis the state or market actors and whether they can live up to these (Bebbington et al, 2008; Banks et al, 2015; Rainey et al, 2016; Lewis and Schuller, 2017; Salamon and Sokolowski, 2017). Others have investigated strategies of and relationships between NGOs of different sizes (eg Mawdsley et al, 2005; Berghmans et al, 2017) and their relationships across the broader aid chain or in new models of public–private-NGO partnerships (Bano, 2018; AbouAssi and Bowman, 2017; Bendell, 2017; Bukenya, 2017; Archer, 2010; Develtere and De Bruyn, 2009). This includes a long-standing critique of whether their modus operandi enables NGOs to fulfil their foundational claims, namely the political roles through which they seek transformative social justice, as well as meet immediate needs and outcomes through providing services, infrastructure, or more tangible outputs (Bebbington et al, 2008; Banks et al, 2015; Suarez and Gugerty, 2016; Atia and Herrold, 2018). The question of the legitimacy of NGOs – in the eyes of the public, donors, intended beneficiaries and peer organisations – is therefore another central pillar in the academic literature, including how this is shaped by strategies and actions, power and relationships and media coverage, among others (cf Gibelman and Gelman 2001; Marburg et al 2016; Walton et al 2016; Keating and Thrandardottir 2017; Hielscher et al 2017).
This is an important literature, enabling a critical perspective on the operations of an influential sector. It allows us to recognise the importance of diversity: across different types and sizes of development NGO and across different ways of working (including in different operational settings and on different priorities). It also allows us to analyse the influence of these differences on outcomes, such as impact and effectiveness. Yet we cannot ‘add up’ everything we know from studies of individual or small collectives of development NGOs to help us understand the sector as a whole. Such an endeavour needs to be systematic; it needs to cover the same variables and all organisations within the sector.
Despite studies highlighting the increasing scale and importance of development NGOs to global development efforts (Koch et al, 2009; Atkinson et al, 2012), a lack of rigorous, sector-wide insight is plain in research to date. No databases exist that can help us map the size and structure of development NGO sectors nationally or globally, or understand who funds them, and how these have changed over time. Estimations and assumptions exist on these issues, but we believe that moving beyond such approximations is critical in our knowledge of development NGO sectors. Systematic mapping, in this manner would bring new empirical insight into these things but would also shed greater theoretical light on the sector as a whole, helping us to understand how NGOs of different shapes and sizes and their political, economic and geographic constructs of power and practice shape language and discourse across the sector and the broader aid chain (Apthorpe, 2011).
2.2. In-depth explorations of NGOs in the Global South
A sectoral framing is more common in research on development NGOs in the Global South. There appears to be more willingness to extrapolate on comparative work and generalise findings to the greater sector as a whole. Applied research exploring the prevalence, strategies, activities and partnerships of NGOs across the Global South comprises another sub-group of NGO research. By virtue of the scope taken in the framing and design of these projects, such research by and large sees the benefits – despite definitional differences that arise – of understanding NGOs as a sector.
Some authors have looked more broadly at the NGO sector in particular countries, including Kenya (Brass, 2012; Wood, 2016), Ghana (Arhin et al, 2018; Arhin, 2016; Kumi, 2017; Bawole and Hossain, 2015), Uganda (Omona and Mukuye, 2013; Burger and Owens, 2013; Barr and Fafchamps, 2006; Dodsworth, 2017) Bangladesh (Lewis, 2017; Fruttero and Gauri, 2005), Ethiopia (Dupuy et al, 2015), or Liberia (Krawczyk, 2017), among others. Across diverse contexts, some explore the geographic distribution of NGOs and their activities (and what influences these) (eg Brass, 2012; Fruttero and Gauri, 2005). Others have looked at the challenges they are facing and responding to as a sector, given changes to the development agenda, aid architecture and funding trends, strategies and channels (eg the shift from the Millennium Development Goals (MDGs) to the Sustainable Development Goals (SDGs) or aid being reduced to countries transitioning to lower-middle-income status) (Arhin et al, 2018; Appe, 2017; Appe et al, 2017; Alonso et al, 2014; Burger and Owens, 2013; Kumi, 2017; Dupuy and Prakash, 2017; Krawczyk, 2017; Mutongwizo, 2017). Some look at the ways in which NGOs are facing or responding to increasingly restrictive operating environments (Wood, 2016 ; Jalali, 2008; Christensen and Weinstein, 2013; Dupuy and Prakash, 2015; Popplewell, 2018) or at problems with and challenges to NGOs’ credibility and legitimacy as a result of claims of patronage or struggles to fulfil more transformative approaches to development (Appe et al, 2017; Atia and Harrold, 2018; Barr and Fafchamps, 2006; Dodsworth, 2017; Lewis, 2017; Omona and Mukuye, 2013).
Alongside research exploring development NGOs by country of operation, another literature explores development NGOs across operational sectors, such as water and sanitation (Power and Wanner, 2017), health (Gideon and Porter, 2016), electricity and power (MacClean et al, 2015), women’s empowerment (Goldman and Little, 2015; Bernal and Grewal, 2014; Gideon and Porter, 2016), environmental concerns (Cook et al, 2017); conservation (Brockington and Scholfield 2010a, 2010b) and HIV/AIDS (Bukenya, 2017). Several explore NGO operations across settings, such as rural and urban areas (Power and Wanner, 2017; Urquia-Grande et al, 2017) or regionally/continentally (Hsu et al, 2016; Brass, 2016; MacClean et al, 2015; Appe, 2017; Mutongwizo, 2017), coverage and effectiveness across different spaces and contexts (Ronalds, 2010; Amagoh, 2015; Stanley et al, 2017) or, conversely, highlighting the difficulties of assessing impact across these (eg Vallejo and when, 2016).
These diverse literatures recognise the importance of analysing across NGOs within countries and settings or along operational priorities or settings. This suggests that our understanding of activities and outcomes can be deepened by a sectoral approach. Yet most of this research is – quite understandably – based on a sample of organisations, revealing insight into phenomena that illuminate new empirical findings, test assumptions, and develop or feed into new theoretical developments that can be tested in other contexts or case studies.3 Few studies are able to undertake a wider sectoral analysis across these domains, given the efforts that would have to go into compiling something across that scale, within one country or operational priority, let alone at the global level. Understandably, therefore, projects that explore a range of NGOs in a country, sector or setting, but are compiled without the benefit of a sample frame, tend to be the ‘norm’ for providing sectoral insights.
2.3. Explorations of Northern NGOs and their operations and partnerships
There is less research into development NGOs in the Global North as a sector. The literature here tends to focus on relationships and positioning: between international development NGOs and donors, and between such NGOs and their Global South partners. The best exception of which we are aware is only just being published. Davis (in press) has created a database of 991 Canadian development NGOs, finding that they are financially significant players with an average annual expenditure of Can$3.4 billion (just under £2 billion) across 2011–2015. This is equivalent to 62% of official Canadian ODA in 2015.4 He also finds that 14 ODA-eligible countries receive more aid from Canadian NGOs than they do from Canadian ODA (Davis, in press).
But this kind of work is rare. Other studies are much less comprehensive. Koch et al (2009) analysed the distributional choices of international NGOs across several OECD countries to explore why they operate where they do. This reveals new insight and confirms commonly held assumptions behind the geographical choices of international NGO aid across OECD contexts. Their methodology speaks to some of the difficulties of large-scale sectoral analyses of international development NGO sectors. Information on geographic location of NGO activities is not comprehensively available in annual reports, nor compiled in pre-existing databases. The authors had to rely upon personal requests to 98 NGOs for data and, while they had a good response rate of 66%, several of the largest organisations were missing from their final sample. This cross-OECD-country approach also (understandably) meant that they had to focus on the largest NGOs within each of the 13 countries they studied. Through this, they could capture the lion’s share of expenditure, but could not study the activities and geographic decision making of international NGOs spending less than €10 million in 2005.
Similarly there are several rich empirical analyses of some of the largest individual Northern NGOs like Oxfam (Black, 1992; Crewe, 2018; Footitt, 2017), ActionAid (Archer, 2010), Amnesty International (Fernandez-Aballi, 2016), the African Wildlife Foundation (Sachedina, 2008) or the Dutch NGO ICCO (Elbers and Schulpen, 2015. Again, here, knowledge is concentrated on the largest NGOs. There are also qualitative studies across international NGOs, such as Stroup and Wong’s (2017) The Authority Trap. Another small body of research, strengthened by contributions from practitioner–insider insight, looks at the challenges international NGOs are facing and how they are responding to them. Several authors highlight the lack of robust strategic planning within international NGOs in the face of aid uncertainty and aid withdrawal, or future thinking around ‘life beyond aid’ (see, for example, Hayman, 2016; Fowler, 2016; Hayman and Lewis, 2017).5
Much of the detail that we know about Northern-based development NGOs predominantly concerns the experiences of a relatively small number of the largest ones. These may be heavy-hitters in the overall development NGO sector, but they do not necessarily look like, act like, or operate in the same manner as development NGOs across the size spectrum. Sectors contain great diversity. Bachke et al (2014), for example, highlight the huge differences between Norwegian NGOs in terms of where their income comes from: some collect more than 90% of their income from private donors, others receive as much as 80% from the Norwegian Government.. Likewise, in Canada, Davis (in press) identifies a significant discrepancy between the dominant narrative of development NGOs being largely publically funded and the reality that only 13% receive any form of government funding.
A clearer understanding of any country’s development NGOs requires moving beyond the largest. We need to develop our understanding across different categories of NGO within the sector; this is essential if we want to understand how individual development NGOs (or meaningful size categories of development NGO) are positioned within the overall sector – and the implications of this for their status, viability and vulnerability to change. This brings additional benefits too: once we have the data that allow us to explore variation across development NGOs within the sector, these can also be rigorously analysed to see how these contributions add up. But nowhere does there exist a comprehensive list of every NGO working solely or primarily in international development, or of their incomes, income sources and expenditures over time.
The present study attempts to meet this deficit by focusing on development NGOs based in Britain. We have chosen this country partly because it is generally recognised that the UK’s development NGO sector is among the most remarkable in the world. An early project mapping Global Civil Society found international activities to be the one area in which the UK’s third sector was significantly larger than that of any other country in the world (Salamon et al, 1999). Many of the most influential development NGOs are based or have originated in the UK and, especially in comparison to the size of the country’s population, the sector is large, complex and enduring. Its power reaches home as well as internationally, with the biggest international NGOs having gained positions of influence in domestic government policy (Stroup and Wong, 2017). We take this focus also because the systematic understanding that we seek is not readily available in existing studies of Britain’s development NGO sector. Previous attention has focused on the work of the largest organisations (Atkinson et al, 2012), or on international NGOs that do not necessarily involve development causes (Clifford, 2016). Lastly, in Britain, the availability of data in the public domain through the institutions that govern charities allows us to collect data relatively easily, and our own networks and location made this easier.
Some insights into recent changes exist from these publicly available data. Research by the National Council of Voluntary Organisations (NCVO, 2016) suggests that charities generally in England and Wales have suffered financially since the 2008 economic crisis and have yet to recover. A slow economic recovery from the 2008 crash led to a stagnation in overall charitable funding, coupled with a redistribution in the sector’s spending powers from smaller to larger organisations. Fiscal retrenchment was responsible for large reductions in activity (estimated at £1.7 billion of government funding), at the same time as constrained household finances and increased demand for voluntary sector services increased pressure on the sector (NCVO, 2016). Alongside the large losses in government funding, it seems to be the public that has responded to this increased demand; individual giving grew by £2.3 billion between 2010 and 2015 (NCVO, 2016).
However Kane et al’s (2016) analysis of trends in data from 212 BOND members suggests that the development sector has proven relatively insulated against the squeeze experienced by other UK charities.6 In contrast to the wider charitable sector, government funding to development NGOs has increased. Despite austerity measures, ODA increased from £8,766 million in 2012 to £11,462 million in 2013, the largest increase since ODA was first introduced (DfID, 2014). This culminated in the 2015 International Development Bill, enshrining in law the commitment to spend 0.7% of Gross National Income on ODA.7
This recent history of growth suggests the sector has been enjoying (comparatively) good fortunes. There has been no visible evidence of a sector in decline or experiencing the economic shocks that hit the UK’s wider charitable sector in recent years. Yet this positive story has also been accompanied by a rising anti-aid narrative, magnified in the press and public opinion by the Oxfam and Save the Children abuse scandals in 2018. From discussions with NGO representatives there is also a strong sense that things have changed, and that clouds are looming on the horizon. Until now, no sector-wide study has been able to show whether or not this is the case.
3. Mapping Britain’s development NGOs: our methodology
Any attempt to map complex sectors has to be approached with caution. A map is a simplification. It is a representation that is constructed according to particular rules. Likewise any database of organisations is constructed by its definitions and rules of exclusion and inclusion. The quality of a map or database hinges on whether its rules and simplifications capture meaningful socially recognised categories.
We defined an NGO in Britain as an entity that was registered with the Charity Commission (in England and Wales) or the Office of the Scottish Charity Regulator (in Scotland). Our definition of a development NGO was more complicated. In the first instance we used a self-identification approach – choosing organisations that identified as development NGOs strongly enough to have joined umbrella organisations. In Britain there are four: BOND, Scotland’s International Development Alliance, the Wales and South West International Development Network and South Yorkshire International Development Network. We then reviewed members of two umbrella organisations of small NGOs (the Foundation for Social Improvement and the Small Charities Coalition) and grantee lists of DfID and Comic Relief, and those organisations which declared their interests in ‘ODA and famine relief’ on the Charity Commission (representing organisations in England and Wales) website. Finally, we used our own ‘snowballing’ of contacts and networks to find development NGOs that we might have missed, including social media requests for NGOs to check their presence and data in our database.
We screened over 1,500 development NGOs in this process, generating a final list of 895 organisations. This screening process evaluated each organisation against pre-defined criteria that shaped the boundaries of our database. We excluded:
- Organisations not registered as charities.
- Organisations whose primary purposes are not international development (for example Leonard Cheshire or the Royal National Lifeboat Institution), on the basis that including those for whom the majority of income was not spent on international development would skew the database.
- Organisations that primarily give grants to UK-based groups, on the basis that this would increase the prevalence of ‘double-counting’ of income in the sector. Thus we excluded Comic Relief and the Disasters Emergency Committee.
- Organisations that spent less than £10,000 per annum on average between 2011 and 2015.
- Organisations that are primarily religious NGOs. For the purpose of this research we have defined ‘primarily religious NGOs’ as organisations that spend much time and money on a set of activities (missionary work, church or mosque building) not undertaken by secular organisations. We have, however, included many organisations with a religious underpinning, such as Christian Aid, Tearfund and Islamic Relief, whose activities resemble those of secular organisations.
These last two exclusions were made regretfully as a result of our lack of capacity to take them on within a reasonable timeframe. Both small and religious organisations make significant contributions to the development NGO sector, but their sheer number made it prohibitive to include them. The Charities Commission of England and Wales records 11,079 charities registering an interest in ‘ODA/Famine Relief’. This means we have less than 10% of them in our map of 895 development NGOs. The majority of excluded organisations from this total – over 9,600 – consist of small organisations spending less than £10,000 per annum.
We wrote to all the organisations on these lists explaining the nature of our research and presenting the lists of excluded and included organisations for their comment. This resulted in very few changes.8
After creating this list we compiled information on finances and activities for these 895 NGOs. Some data are more easily available than others. Income and expenditure figures from 2004 can be downloaded from the Charity Commission website. This gave us income and expenditure data for 828 of English and Welsh NGOs from 2004 to 2015, to which we added information on their geographic location, establishment date and activities by drawing upon annual reports and websites.9 Scottish NGOs are governed by the Office of the Scottish Charity Regulator and these data are harder to collect, but we collected income and expenditure figures (from 2009 to 2015) for the 67 Scottish organisations on our list using annual reports.
The data thus collected were for financial years, the start dates of which were highly variable across NGOs. We have constructed income and expenditure for calendar years, by assuming that expenditure and income were evenly spread throughout the year, and allocating figures to calendar years accordingly.10 We also standardised calendar year data, so that, where data are not available for the whole calendar year or, on occasion, financial years overlap so that the same months are reported twice, these discrepancies can be removed. We controlled for inflation; all figures presented here report figures in UK pounds as valued in 2015.11
We also wanted to understand where development NGO income comes from. For this we created a second database, drawing upon data from the NCVO that breaks down NGO income by income source.12 The NCVO runs a Civil Society Almanac, collecting detailed annual records of income sources for a large sample of NGOs. These data are compiled the year after annual reports are completed. We were able to obtain data that ran from 2009 to 2014.
The Almanac database is structured by organisation size. Records of all the largest NGOs (income over £100 million) are created each year. But, for smaller organisations, data are sampled, with the size of the sample depending on the size category of the organisation.13 Every year a new sample of organisations is taken. This means that the Almanac does not follow the same organisations every year.
Cross-referencing the contents of the Almanac sample with our database across the period gave us a list of 400 development NGOs from our initial 895. However, we did not have complete records for all these organisations from 2009 to 2014. An organisation that appeared in the 2010 sample might not appear again in subsequent years.14 This was particularly the case for smaller organisations, where the chance of being selected at all was slim. We therefore supplemented Almanac data with our own records, filling in missing years (from annual reports) and adding smaller organisations which were less well represented, randomly selecting these from our full list of 895 development NGOs. This gave us income records for a sample of 569 development NGOs, and their income sources and fundraising costs across our period of study. These represent 65% of the organisations on our list and over 95% of the sector’s expenditure (for details see Brockington and Banks, 2017).
4. Mapping Britain’s development NGO sector: our findings
4.1 The development NGO sector in 2015
The sector’s expenditure in 2015 was £6.96 billion. This is a large sum, equivalent to just over 55% of UK ODA for the same year. A small element is composed of UK government funding. The largest organisation (the British Council), which spends more than £900 million, received considerable support from the UK government. Hundreds of millions are also contributed by DfID to development NGOs based in the UK. There is also some double counting in these sums, in that organisations are funding each other. Save the Children UK contributed nearly £200 million to Save the Children International, for example. While we have tried to reduce double counting by excluding organisations that are grant-making from our database, it is impossible to catch all of them. On the other hand, some organisations spending tens of millions on international development causes are excluded from this list because they spend more money on the UK (eg Leonard Cheshire). We have therefore left this overall figure unaltered.
While a considerable sum, this is small relative to expenditure by the charitable sector as a whole. Charity Commission data show that 78% of the sector’s £68 billion turnover in 2015 was spent by charities only operating within England and Wales (Table 1). This makes the development NGO sector’s expenditure of £6.98 billion less than 10% of all charitable funding in England and Wales.
Table 1: Charitable expenditure in England and Wales by remit of the organisation
|
Remit |
All charities’ expenditure 2015 (£ million) |
Percentage |
|
Only within UK |
53,238 |
78 |
|
UK and beyond |
12,164 |
18 |
|
Only beyond UK |
2,946 |
4 |
|
Total |
68,347 |
100 |
Note: These data only concern charities based in England and Wales. We could not get equivalent remit data for Scottish charities.
Source: Charities Commission Data.
This expenditure is highly uneven across the sector (Table 2). We break down development NGOs into eight different size classifications.15 The 77 largest NGOs (spending £10 million and above in 2015 and constituting 8% of organisations) controlled nearly 90% of the sector’s expenditure. Meanwhile, at the bottom of the pyramid, over 800 organisations earning less than £1 million account for just 13% of the sector’s expenditure. This unevenness would be even more concentrated if the myriad small NGOs spending less than £10,000 per year were included.
Table 2: The size and structure of the sector: expenditure in 2015
|
Size class |
Expenditure (£ millions) |
Expenditure (%) |
Count |
Count (%) |
|
>100m |
3,537 |
51 |
9 |
1 |
|
>40m |
1,460 |
21 |
19 |
2 |
|
>10m |
1,082 |
16 |
48 |
5 |
|
>3m |
453 |
7 |
75 |
8 |
|
>1m |
245 |
4 |
126 |
14 |
|
>500k |
97 |
1 |
125 |
14 |
|
>100k |
75 |
1 |
276 |
31 |
|
>10k |
11 |
0.2 |
209 |
24 |
|
Total |
6,959 |
|
887 |
|
Note: while we have 895 NGOs in our database, not all had submitted expenditure records at the time of our analysis.
Source: Authors’ compilation and analysis of Charity Commission and OSCR Data.
We can also analyse the geographic spread of expenditure. We located NGO headquarters across five regions in mainland UK (Scotland, the North and North Wales, Southwest England and South Wales, Southeast England – excluding London – and London) based on their headquarters’ postcodes. London dominates the development NGO scene (Figure 1), both numerically (with 46% of all organisations based there), but also in terms of housing the largest NGOs. Of the largest 76 organisations dominating the sector’s expenditure, 67% are found in London (82% if we include the Southeast). London-headquartered development NGOs spent three-quarters of the sector’s income in 2015 (90% if we include the Southeast) (Table 3). This geography is no surprise to many in the sector, but its precise quantification may be.
Figure 1: The distribution of development NGOs in the mainland UK
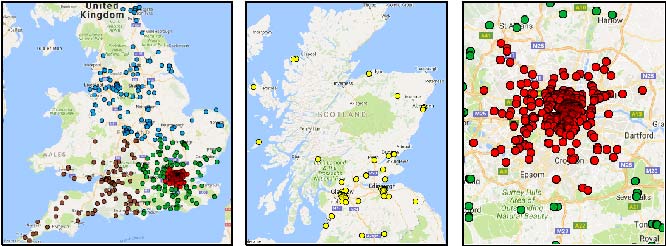
Table 3: Money spent in 2015 (£millions) by development NGOs headquartered in different regions in the UK
|
Size class |
London |
SE not London |
SW |
North |
Scotland |
Total |
|
>100m |
2,928 |
609 |
- |
- |
- |
3,537 |
|
>40m |
1,141 |
154 |
- |
113 |
53 |
1,460 |
|
>10m |
648 |
145 |
36 |
144 |
108 |
1,082 |
|
>3m |
282 |
65 |
36 |
53 |
18 |
453 |
|
>1m |
134 |
53 |
19 |
31 |
9 |
245 |
|
>500k |
55 |
16 |
6 |
14 |
5 |
97 |
|
>100k |
33 |
15 |
8 |
12 |
7 |
75 |
|
>10k |
4 |
2 |
2 |
2 |
1 |
11 |
|
Total |
5,224 |
1,058 |
107 |
69 |
201 |
6,959 |
Source: Authors’ compilation and analysis of Charity Commission and OSCR Data.
4.2 Financial changes in the sector over time
Both the number of NGOs and their expenditure grew steadily between 2009 and 2015 (Figure 2). The number of organisations has grown from 676 to 881 (a rise of 30%), and the sector’s overall expenditure by 45%. The dip in expenditure in 2012 was driven by a decline in the largest organisations that was not as prominent in smaller organisations.
Figure 2: The growth of development NGOs and development NGO expenditure (2004–2015)
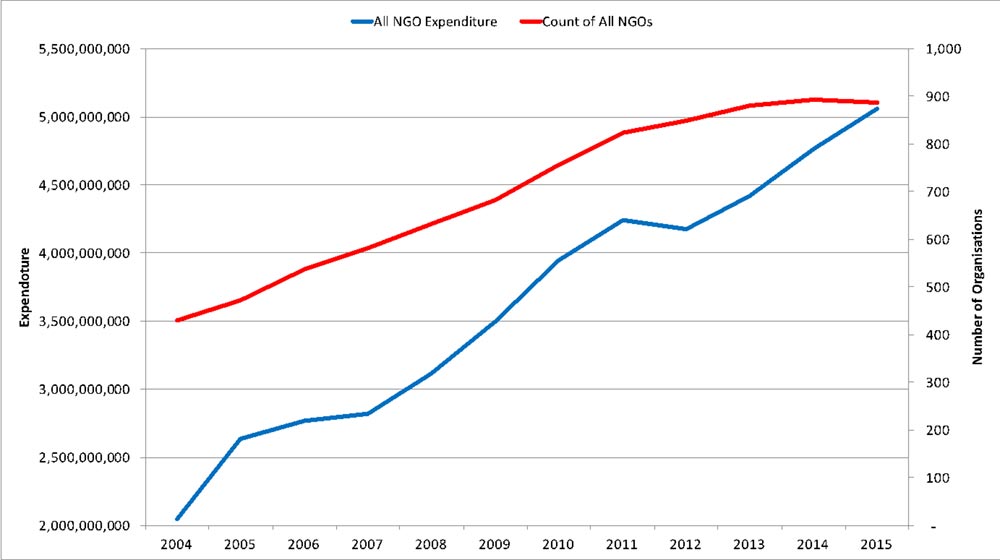
Note: We have excluded the British Council, as its government funding makes it unrepresentative of the sector, and its size distorts trends. We also excluded Save the Children International and a few other smaller organisations because they show dramatic changes in expenditure because of internal reorganisation, as detailed in Brockington and Banks (2017).
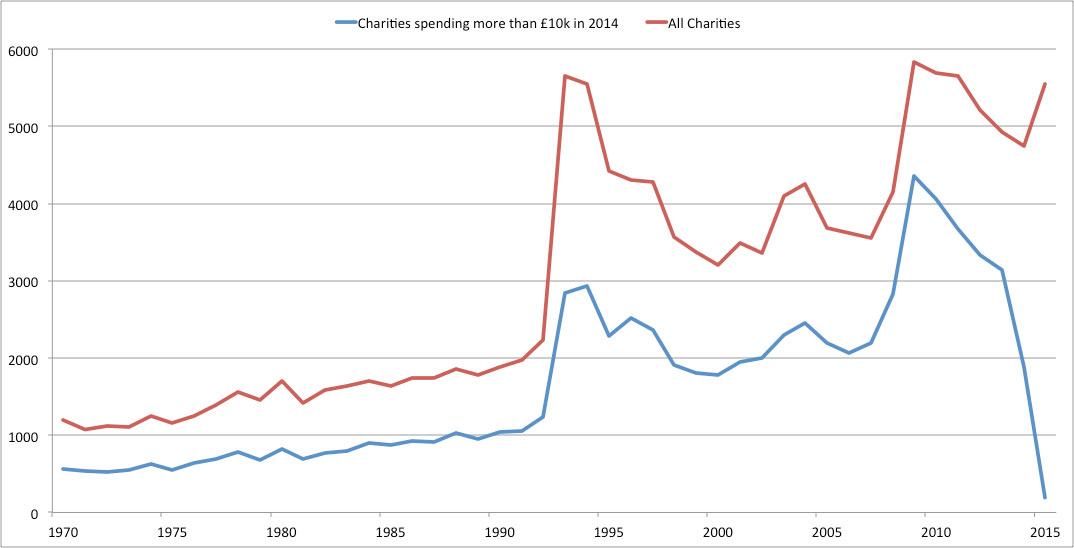
Figure 3 shows that the growth of new development organisations in the UK has been increasingly vigorous since the 1980s, with ‘jumps’ in the early 1990s and the mid-2000s. 2008’s black line marks the economic crisis. The drop-off in organisations following this may suggest an apparent decline in NGO establishment since then. But, in fact, this is an artefact of our methods: we excluded organisations spending less than £10,000 in 2015. It takes several years for organisations to reach this size. This is demonstrated in Figure 4, which shows the establishment trends of all charities in England and Wales. If we exclude organisations earning less than £10,000, then we also see an apparent decline between 2010 and 2015 (the bottom blue line). But if we remove this criterion to look at all organisations (the top red line), this decline disappears.
Figure 3: The growth of development NGOs (expenditure >£10k)
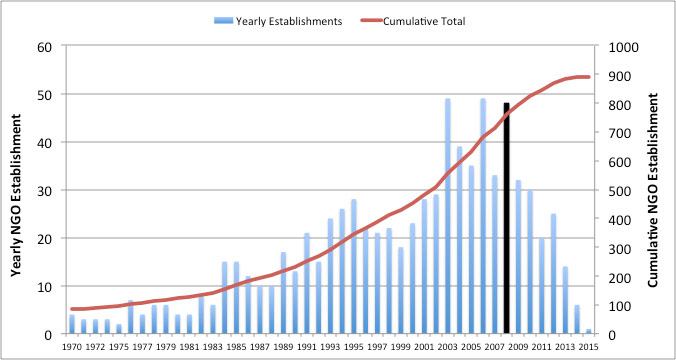
Figure 4: Establishment trends of all English and Welsh charities
These data suggest that, until 2015 at least, there are no indications in these data that the sector has somehow peaked, or become saturated. The data also suggest that this sector is not as rivalrous as we may think. Contests for funding seem to be taking place within a context of increasing funding for all sizes of organisation. As reported elsewhere (Kane et al, 2016), the development NGO sector has been relatively insulated from the economic crises and more difficult operating environments that have hit the broader charitable sector.
It is possible that our methods only selected ‘survivor’ NGOs and that we missed organisations that have ceased to operate. If this were the case, the apparent rise in organisations we have described may be reduced. However, we have not heard of many large organisations that have ceased to exist or merged; nor did our consultation exercise mention them. There are some (for example Merlin, Progressio and Village Aid), but they are few. If there was such a high rate of attrition, we suspect that the sector would already know about it.
On average all size classes of organisation have grown (Table 4, column 1), but the averages conceal remarkable variability across the sector, with high ranges and standard deviations within each size class (Table 4). This shows that growth trends are more secure in larger organisations. Averaging within each size class, standard deviations of expenditure from 2010 to 2015 tend to be lower in the larger organisations, when expressed as a percentage of mean expenditure. Expenditure can fluctuate considerably year on year for the smallest organisations, where mean increases in growth conceal remarkable ranges of experience (Table 4). More money for the sector as a whole entails numerous instances of substantial decline.
Table 4: Variability in expenditure trends per size class 2009–2015
|
Size Class |
Average increase in expenditure 2009–2015 (£000s) |
Maximum increase per size class (£000s) |
Greatest decline per size class (£000s) |
Range of expenditure change 2009–2015 as a % of average expenditure increase |
Std Dev of expenditure change 2009–2015 (£000s) |
Std Dev as % of mean expenditure |
|
>100m |
78,623 |
142,321 |
-10,843 |
1.9 |
27,058 |
12 |
|
>40m |
21,140 |
86,804 |
-5,915 |
3.6 |
10,925 |
18 |
|
>10m |
6,658 |
40,880 |
-21,706 |
9.4 |
3,794 |
21 |
|
>3m |
2,020 |
11,027 |
-14,461 |
12.6 |
1,431 |
30 |
|
>1m |
502 |
4,402 |
-8,373 |
25.4 |
465 |
27 |
|
>500k |
292 |
2,124 |
-1,841 |
13.6 |
199 |
31 |
|
>100k |
103 |
1,370 |
-1,196 |
25.0 |
81 |
35 |
|
>10k |
23 |
172 |
-188 |
15.4 |
19 |
43 |
Source: Authors’ own data with organisations excluded as per Figure 2
4.3 Where does development NGO expenditure come from?
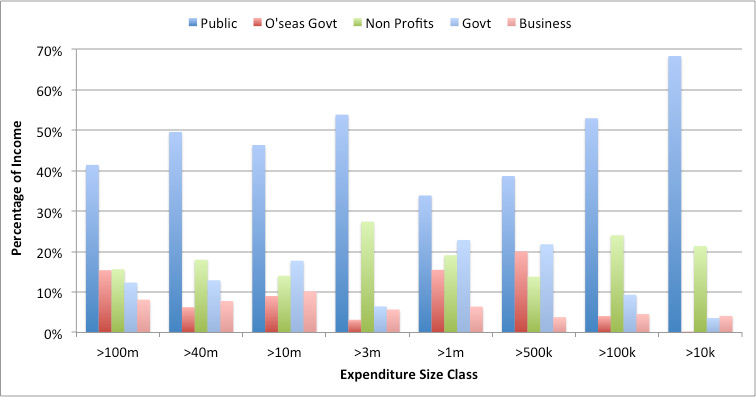
Donations from the public have been by far the most important source of funds for UK development NGOs, contributing nearly £10 billion over five years and 40% of the sector’s total income over this period – more than the next two largest sources combined (Table 5). The other three major donors – the UK government, other non-profits and overseas governments - together comprised a further 48% of income. The business sector is not a large funder of development NGO activities, contributing 7% of income over the period. Relatively, public funding has declined in importance as funding from other non-profits, the UK government and overseas governments has risen, and the importance of different funding sources for an individual development NGO varies substantially by its size classification (Figure 5). Larger volumes of other funds leave larger NGOs less dependent on public funds, while the smallest receive almost 70% of their income from the public.
Table 5: Total income from different sources for Development NGOs 2009–2014
|
Source |
Income (£ millions) |
Proportion |
|
Public |
9,957 |
40% |
|
Government |
4,282 |
17% |
|
Non-profit sector |
3,946 |
16% |
|
Overseas governments |
3,810 |
15% |
|
Business sector |
1,657 |
7% |
|
Ind govt funded bodies |
813 |
3% |
|
Investments |
158 |
0.6% |
|
Unclassified |
105 |
0.4% |
|
National Lottery |
87 |
0.4% |
|
Total |
24,815 |
|
Source: Authors’ analysis of NCVO data.
Figure 5: Sources of income, by size class (2009–2014)
Note: For ease of interpretation we have removed the smallest income sources from this graphical representation: industry government funded bodies, investments, national lottery and ‘unclassified’. Together these constitute around 4% of the sector’s income across this period.
Changes in UK government funding reflect the UK’s legally-enshrined commitment to spending 0.7% of Gross National Income (GNI) on ODA causes. Government spending increased from around 15% of the sector’s income in 2010 to around 20% in 2014 (Figure 6). This equates to a rise of £297,640,231 (in real terms between 2010 and 2014) and has meant that, while public funds have continued to grow, they have declined in relative importance as other income sources have grown.
Figure 6: Changes in funding, as a proportion of income across the sector
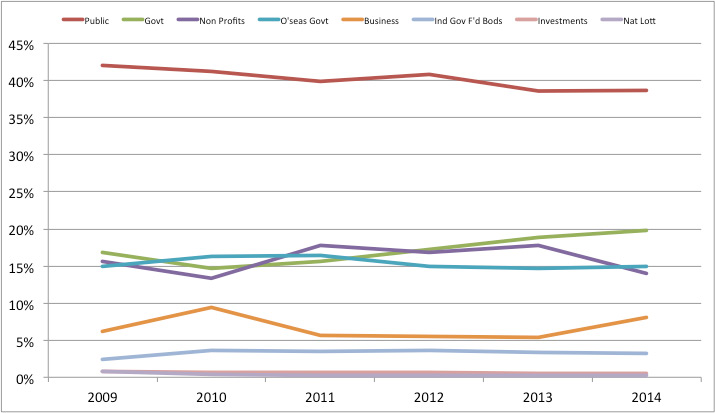
Table 6: Change in income from different sources for different size classes (£ millions)
|
Source |
2009 |
2010 |
2011 |
2012 |
2013 |
2014 |
|
Public |
1,560 |
1,636 |
1,663 |
1,650 |
1,704 |
1,745 |
|
Govt |
623 |
581 |
655 |
697 |
832 |
894 |
|
Non-profits |
580 |
529 |
740 |
683 |
785 |
630 |
|
O'seas gov’t |
554 |
645 |
684 |
603 |
648 |
677 |
|
Business |
228 |
372 |
236 |
220 |
237 |
363 |
|
Ind gov f'd bodies |
87 |
142 |
144 |
144 |
149 |
147 |
|
Investments |
30 |
25 |
28 |
26 |
25 |
23 |
|
Unclassified |
17 |
16 |
13 |
1 |
25 |
23 |
|
Nat Lottery |
28 |
16 |
12 |
9 |
10 |
13 |
|
Total |
3,706 |
3,962 |
4,176 |
4,043 |
4,415 |
4,514 |
Source: Authors’ analysis of NCVO data.
However, there are important patterns in the changing source of funds according to the size class of the NGOs (Table 7). Most public donations – 82% – go to the top three size classifications of development NGOs (those 8% of organisations earning over £10 million in 2015). Yet, alongside this, it is actually mid-sized development NGOs (spending between £1m and £40m in 2015) that have been the driving force behind the public’s increased funding. These three categories of development NGO have seen the greatest increases in income from the public, in relative and absolute terms (Table 7). The two largest size classes, despite having a collective turnover that is double that of the next three size classes (£3.2 billion compared with £1.2 billion) have not enjoyed the increased successes in fundraising from the public that their smaller siblings have seen. In contrast, the top two size classes have seen much more dramatic growth in income from government money and from foundations and other non-profits.
Public donations are particularly important for the smallest organisations, providing 68% (on average) of total funding for NGOs spending between £10,000 and £100,000. Only 4% of revenues come from the UK government to this group. On reaching £10 million turnover, overseas governments become core sources of funding for development NGOs. Foundations and non-profits have not sought to invest in medium-sized organisations spending between £3 million and £10 million. Likewise, the corporate sector is plainly targeted at the largest organisations, particularly those in the >£40million classification. All development NGOs below this size have seen a decrease in relative and proportional funds from businesses between 2009/10 and 2013/14.
Increases in UK government funding have clearly benefited the largest organisations. The biggest NGOs (those spending more than £100 million in 2015) received an average of 86% more from UK government sources in 2014, compared with that received in 2010. The next biggest increases were for those NGOs spending between £3 million and £10 million: their average UK government income increased by 59% over the same period. Smaller NGOs benefited least, with government funding to the smallest size category decreasing by 13% over the same period. The effects of this have been mitigated by increased funding from other non-profits in this size class, as we discuss shortly. There is a negative relationship between public funding and UK government funding – those organisations which are most reliant on the public are least reliant on government. Many of these are smaller organisations which are not well placed to bid for government funding.
Figure 7: The relationship between UK government and public funding
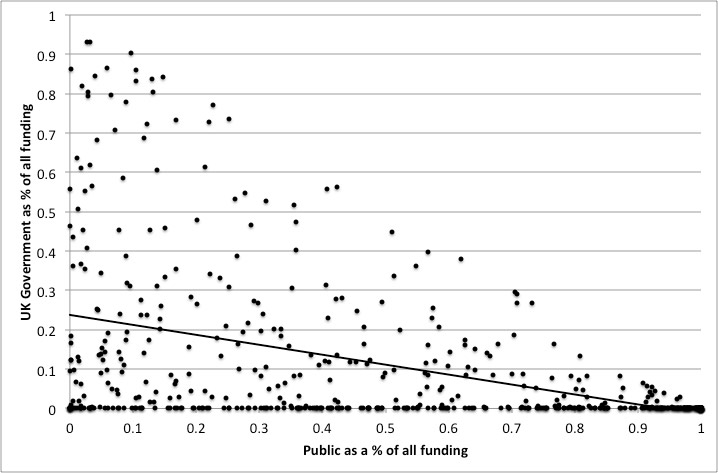
Notes: R2 = 0.206; F = 149.085; p >0.001.
Table 7: Change in income from different sources for different size classes
|
Size class |
Mean Income per organisation 2009, 2010 |
Mean income per organisation 2013, 2014 |
Change in mean income per organisation |
Average total annual income 2009, 2010 |
Average total annual income 2013, 2014 |
Change in average total annual income |
Absolute increase from 2009/10 to 2013/14 |
|
Income from the public |
|||||||
|
>100m |
92,553 |
95,292 |
3% |
647,872 |
667,047 |
3% |
19,175 |
|
>40m |
23,493 |
24,953 |
6% |
422,881 |
449,148 |
6% |
26,267 |
|
>10m |
5,574 |
6,905 |
24% |
245,270 |
277,220 |
13% |
31,950 |
|
>3m |
2,250 |
2,503 |
11% |
153,006 |
174,915 |
14% |
21,908 |
|
>1m |
805 |
894 |
11% |
83,429 |
104,550 |
25% |
21,121 |
|
>500k |
351 |
372 |
6% |
27,968 |
31,724 |
13% |
3,756 |
|
>100k |
150 |
135 |
-10% |
15,285 |
16,386 |
7% |
1,101 |
|
>10k |
40 |
41 |
1% |
2,074 |
3,315 |
60% |
1,241 |
|
Income from non-profits |
|||||||
|
>100m |
28,261 |
38,287 |
35% |
197,824 |
268,009 |
35% |
70,185 |
|
>40m |
6,646 |
10,015 |
51% |
119,633 |
180,272 |
51% |
60,639 |
|
>10m |
3,169 |
3,433 |
8% |
139,419 |
139,983 |
0% |
564 |
|
>3m |
731 |
718 |
-2% |
49,727 |
50,275 |
1% |
548 |
|
>1m |
283 |
353 |
25% |
29,229 |
41,313 |
41% |
12,084 |
|
>500k |
134 |
203 |
52% |
10,692 |
17,325 |
62% |
6,633 |
|
>100k |
69 |
75 |
9% |
7,043 |
9,103 |
29% |
2,060 |
|
>10k |
11 |
14 |
29% |
588 |
1,165 |
98% |
577 |
|
Income from the UK government |
|||||||
|
>100m |
20,095 |
37,296 |
86% |
140,667 |
261,072 |
86% |
120,405 |
|
>40m |
11,972 |
15,846 |
32% |
215,501 |
285,232 |
32% |
69,730 |
|
>10m |
3,767 |
5,042 |
34% |
165,736 |
201,941 |
22% |
36,205 |
|
>3m |
704 |
1,089 |
55% |
47,892 |
76,061 |
59% |
28,169 |
|
>1m |
243 |
254 |
5% |
25,095 |
29,672 |
18% |
4,577 |
|
>500k |
70 |
79 |
13% |
5,547 |
6,703 |
21% |
1,156 |
|
>100k |
15 |
18 |
21% |
1,542 |
2,169 |
41% |
627 |
|
>10k |
3 |
2 |
-44% |
173 |
151 |
-13% |
(22) |
|
Income from businesses |
|||||||
|
>100m |
19,881 |
20,125 |
1% |
139,165 |
140,876 |
1% |
1,711 |
|
>40m |
1,511 |
3,652 |
142% |
27,190 |
65,729 |
142% |
38,539 |
|
>10m |
1,484 |
1,151 |
-22% |
65,303 |
46,313 |
-29% |
(18,990) |
|
>3m |
667 |
407 |
-39% |
45,325 |
28,517 |
-37% |
(16,808) |
|
>1m |
178 |
120 |
-33% |
18,400 |
14,004 |
-24% |
(4,396) |
|
>500k |
35 |
31 |
-12% |
2,769 |
2,663 |
-4% |
(107) |
|
>100k |
18 |
14 |
-24% |
1,847 |
1,653 |
-11% |
(194) |
|
>10k |
3 |
2 |
-38% |
175 |
159 |
-9% |
(16) |
4. Discussion
Compelling statistics from this new database provide unique insights into the size, structure and sources of funding of the sector. But what does all this contribute to our knowledge of NGOs in global development? Here we discuss four key themes that emerge from these findings. These are:
- the size and significance of the sector;
- the contrast between development NGOs and other charities;
- sectoral unevenness in expenditure and its remarkable stability;
- changing funding landscapes and increasing intermediation in the sector.
4.1. No longer the ‘next’ development alternative: the size and significance of the sector
Domestic NGO sectors in the Global North are much less investigated in discussions of foreign aid than bilateral and multilateral actors, in academic research or otherwise. This is exemplified by the fact that the most authoritative source on development aid, Aid Data, does not record funds spent by NGOs.16 Yet the funds spent by British-based development NGOs exceed many other individual countries’ recorded expenditure by an order of magnitude. Tierney et al’s (2011) argument that foreign aid debates tend to be driven by inadequate information – an argument made with reference to bilateral and multilateral agencies – could well be extended to include development NGOs.
Ad hoc attempts to explore and discuss NGOs as a sector can give tantalising snippets indicative of the scale and power of development NGO spending. For example, Koch et al’s (2009) finding that 61 NGOs in 13 OECD countries come close to the sum of ODA for the four Scandinavian countries has punch. But, surely, if we are to understand the power of the sector and its relative contribution to international development efforts, the meaningful comparison is with ODA expenditure of the 13 OECD countries where these NGOs are based? Davis’ database of Canadian development NGOs’ expenditure provides the statistics necessary to enable a better comparison. Comparing the average annual expenditure of Canadian NGOs (2011–2015) with Canadian development assistance in 2015 shows this to be the equivalent of more than 60% of Canadian ODA.17
We have found that development NGO expenditure in Britain constitutes a similarly significant amount relative to official ODA. Increasing public, government and foundation funding has elevated the British development NGO sector to a position in which it spends more than half the value of official ODA in 2015. The sector is a major actor in domestic foreign aid efforts, whose size and relative contribution have until now been unquantifiable and, therefore, most probably underestimated.
4.2. ‘Charity begins at home’: contrasting development NGOs and other charities
Our findings also question key media and public narratives about the sector that have built momentum in recent years, following on from ten years of austerity measures and an increasing prioritisation of the national interest. Despite the large and growing sums that the NGO sector is spending on international development – and the substantial 40% of the sector’s income contributed by the public across 2009–2015 – at less than 10% of English and Welsh charitable spending overall in 2015, this is still relatively minor compared with overall charitable turnover.
Why does this matter? These findings are particularly important in an era in which the normative environment surrounding foreign aid is changing. Domestic austerity measures have fuelled perceptions that aid is provided at the expense of ‘the poor’ at home, and voices arguing for a reorientation of foreign aid towards national development have become stronger, in the UK and beyond (Gulrajani, 2017; Heinreich et al, 2016). The phrase ‘charity begins at home’ has been adopted in the right-wing press to advocate reduced spending on development internationally. However, our data show that, in fact, the phrase captures an already existing distribution in the UK’s development NGO sector. This and the strong public support of the sector provide potentially powerful evidence, if evidence is influential here, to counter this anti-aid view.
Furthermore, the fact that the public donates much more to development NGOs than the UK government (which contributed 17% of the sector’s income over the period 2009–2014, in comparison with the public’s 40%) suggests that, for the giving public, development NGOs remain legitimate and important. The key issue here is who this ‘giving public’ is. As Mohan and Bulloch’s work has shown, the charitable sector generally is primarily supported by a ‘civic core’ of about 31% of the nation, which is responsible for 79% of giving and 87% of volunteering (Mohan and Bulloch, 2012). But development NGOs appear to benefit from a special instance of this bespoke supporter action. They may even have their own civic core, for, while the rest of the charitable sector has been struggling in recent years, development organisations have been enjoying healthy growth. They are, relatively, austerity-proof (Kane et al, 2016).
The moral importance for and fundamental belief in the development NGO sector of its civic core becomes more evident if we explore this sustained growth in sectoral income relative to changes to national income. As Figure 7 shows, public giving increases when incomes are squeezed.18
Figure 8: Changes in development NGO expenditure and real household disposable Income
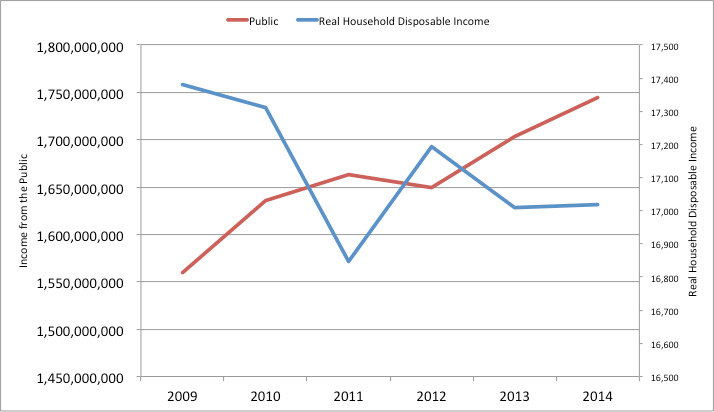
Existing research may shed some light on this at-first-glance contradictory relationship. In the wake of apparent declines in public support for aid in the early 2010s, Henson and Lindstrom (2013) analysed drivers of public support for aid in the UK. They found that it was not an individual’s own changing economic situation that shifted public support for aid, but the collective experience. That is to say, individuals did not experience any shift in propensity to support aid according to the economic squeeze they experienced themselves, but became more supportive of aid cuts when looking at the bigger picture of poverty and economic squeezes at the country level (Henson and Lindstrom, 2013). Contrary to this, similar research in 2016 suggests that the individual experience does matter. Across a broader population of European countries (including the UK) Heinrich et al (2016) found that public support for foreign aid strongly decreases when an individual respondent’s personal economic fortunes worsen. These findings are not necessarily contradictory. It could be the longevity of pressure on incomes that changes beliefs and norms, especially as momentum builds in the public narrative alongside this arguing for a reorientation of aid.
Longitudinal research into the impact of economic crises on foreign aid suggests this may be the case. Using panel data from 24 donor countries between 1977 and 2010 to explore the impact of economic crises on foreign aid, Dang et al (2013) found the worst effects on aid flows to emerge a decade after the initial crisis. An accumulation of factors was influential: repeated shocks to government income, the costs of banking bailouts and increasing public debts as a result of dealing with the effects of crisis, among others. It does not seem far-fetched to think that the impact on individuals mirrors this time-lagged effect. After all, these changes are experienced by the population in the austerity measures used to manage public debt – wage freezes, cuts in public services or a roll back of the welfare state, for example. This may mean that, despite vibrant and sustained growth in the development NGO sector, dark clouds may be looming on the horizon, as a decade after the crisis and after ten years of austerity measures, pressures on individual incomes and perceptions of individual and national ill-being may be at their highest.
But this raises many other important questions. Who, exactly, is the ‘giving public’ when it comes to development NGOs? What motivates them to give – and to give continually more? Perhaps support for this sector should not be understood in terms of what the ‘general public’ or ‘average Briton’ thinks or believes, or even in terms of dominant media or political discourses. Perhaps this is the manifestation of a deep vein of cosmopolitanism and concern for distant strangers coursing powerfully through a significant minority of people. Perhaps the creativity and resources of that minority are yet to be exhausted. Perhaps the sector, by virtue of its growth and vigour, creates the very markets and audiences that it seeks funding and support from.
4.3. The many Davids and the Goliaths: sectoral unevenness and its remarkable stability
The third theme concerns the construction and constitution of the sector. Inequalities within the sector in terms of income, expenditure and geography are well known, but the precise extent is likely to be surprising. A mere 8% of organisations controlled nearly 90% of the sector’s expenditure in 2015, whereas the smallest size category, with 54% of organisations, accounted for only 1.2% of expenditure. These Goliaths are the 77 development NGOs spending over £10 million per annum, the substantial majority of which are in London and the Southeast.
It is only because of our methodology and the systematic mapping that we have undertaken that these distributions can be revealed. Too often the tendency is to discuss or analyse the sector on the basis of its Goliaths. As our data and analysis highlight, this overlooks the work and experience of hundreds (indeed thousands) of small and medium-sized NGOs. Breaking down the sector into different size classes provides a basis to explore more about how these groups experience changes to the funding landscape differently. Understanding this heterogeneity is critical to understanding the sector’s structure at any moment in time or in periods of change.
Looking at how this structure is (or is not) changing in recent years also reveals important new sectoral insights into the stability of this unevenness. Growth in expenditure has taken place across all size classifications, but is strongest in real terms for the largest. This means that there has been little change in how the sector’s expenditure is broken down across size classifications over the five-year period. The general rule is that size categories of development NGOs all increase their expenditure in absolute terms, but do not increase their category’s share of expenditure.
So we see that unevenness in the sector is remarkable both in the extent of its concentration at the top and in its stability, with the market share of different size classifications remaining by and large the same, despite the sector’s 44% growth in expenditure over 2009 to 2015. The growth story in expenditure has been positive across all size classifications and, on average, on individual NGOs within these. But among the smallest NGOs (>£10,000) this expenditure growth has been driven by an increase in organisations, as well as by individual increases in expenditure. There is also much greater variation within these, as the previous section discussed.
4.4. Changing funding landscapes and increasing intermediation in the sector
The last theme to discuss is the implications of changing funding landscapes on NGOs of different size classifications. Exploring this indicates that there is strong conceptual relevance to applying theories not commonly investigated within the development NGO sector to it. Hulme and Edwards’ (1997) Too Close for Comfort was seminal in highlighting the tensions and contradictions for development NGOs in balancing their responsibility to beneficiaries with accountability to donors. Reviewing recent research, Banks et al (2015) found that these concerns remain conceptually valid. This positioning of NGOs within the broader aid chain and the subsequent competing accountabilities they face are the problem here, with funding relationships between development NGOs and donors pulling them away from accountability to Southern partners and beneficiaries. Our findings here reveal another level of complication in these processes – increasing intermediation within the development NGO sector itself.
Changing income in itself, therefore, is not the only variable important to our understanding of the sector. How sources of income are changing across size classifications is also revealing: which organisations gain and lose funding from different sources has important implications for how the sector – and individual organisations within it - functions. Since all size classifications experienced income growth between 2009 and 2015, where categories are losing income from one source, they must be increasing it from other sources. Here, we see an increasing trend towards intermediation within Britain’s development NGO sector.
As Table 7 has shown, the second largest category of organisation – those spending over £40 million in 2015 – has captured the lion’s share of increased funding from business. These NGOs have experienced a 142% increase in their average total annual income from these sources between 2009 and 2014. The top two size classifications of development NGO (>£100m and >£40m) have grown their average annual income from the UK government by 86% and 32%, respectively; organisations in the >£3million category have seen a remarkable 59% increase in average total annual income from government. Meanwhile, all smaller organisations below this have experienced average losses from the UK government and business. The smallest organisations (those earning less than £10,000) have seen an average annual loss in UK government income of 13% over the same period, at the same time as almost doubling their income from other non-profits.
This would suggest that the biggest NGOs, capable of receiving larger block grants, are increasingly becoming mediators of funds before they trickle down to smaller organisations. Our data reveal £3 million expenditure to be the point at which UK government funds become a core component (upwards of 20% of total funds) of institutional funding. With a growing economy and a 0.7% commitment written into law, UKAID (and DfID) has more money to spend, at the same time as austerity measures require it to prune operating budgets and not to increase staff (Figure 9). In this context, where asked to disburse larger sums at faster rates to meet its legal commitments (Gulrajrani, 2017), the benefits of larger grants being awarded to the biggest development NGOs are clear.
Figure 9: UK ODA and DfID staffing levels over time
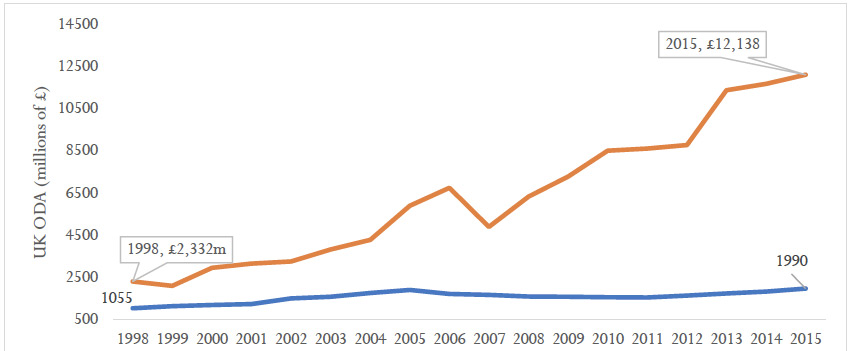
Note: The ODA figures are not DfID expenditure but total ODA.
This pressure is evident in other forms of aid spending, including an increase in outsourcing to the private sector (Evans, 2018). Increasingly, DfID turns to the private sector to help manage large portfolios. These pressures are also driving similar processes within the development NGO sector itself. Larger sums of money are disbursed to the largest NGOs, with smaller NGOs unable to process the volume of funds that DfID needs to shift. Instead smaller charities are relying more on other (larger) charities as sources of funds. It is even possible that the unequal structure of the sector reproduces itself in part because the larger NGOs need the smaller NGOs to help them operate effectively.
These data suggest a number of questions that need to be pursued to generate more evidence-based policies with respect to development NGOs and their funding. First, what are the consequences of increasing intermediation for the functioning of the sector and its relationships with other sectors globally? Second, what kind of partnerships and modalities for accountability exist, and what, if any, strategies are smaller development NGOs utilising to try and renegotiate changing funding spaces? Third, how might DfID and other large funders most effectively engage with a sector whose structure (and geography) can now be seen more clearly?
5. Conclusion
While research on development NGOs alludes to them as a collective – a group which needs to be thought of for its cumulative consequences and influences – it has tended to focus piecemeal on individual NGOs and to concentrate on just the largest. Rigorous and systematic analysis of development NGOs as a sector, whether across countries or operational priorities, has been visibly missing. Our aim here was to rectify this by compiling a comprehensive database detailing incomes, expenditures, income source and geography for 895 development NGOs spending over £10,000 per annum, across the period 2009 to 2015 (2014 for the time-lagged income source data).19 In Britain, these development NGOs are bound by governance authorities that require records of their activities and finance to be held in the public domain, making a more systematic and rigorous approach to understanding development NGOs a difficult, but achievable task.
Our construction of this unique database reveals a thriving development NGO sector that is growing in income, expenditure and number of organisations. In 2015, the sector spent nearly £7 billion, the equivalent of just over half the UK’s ODA for that year. This makes the UK’s development NGO sector a major player in the world of foreign aid, despite a tendency to be spoken of peripherally in discussions around this. We believe that, until now, the lack of comprehensive study has underestimated the role and contributions of development NGOs to foreign aid in Britain.
Across the period 2009 to 2015 we see that, despite expenditure increases right across the sector, it has maintained a remarkably stable structural composition, with a tendency towards concentration of income and expenditure among a small number (8%) of the largest NGOs. We also see that the dynamics at the top and bottom are polarised: despite increases in expenditure across all size classifications, increases in expenditure among the largest NGOs represent the largest increases in real income, while for the smallest NGOs these increases are diluted by larger numbers of such NGOs entering these size classifications and greater variation in individual stories of growth or decline. Changing patterns of income sources across different size classifications point towards an increasing intermediation of development NGO funds domestically within the sector itself: government and business funds have been redirected towards the largest development NGOs, with smaller ones making up for this reduction through funds from other charities.
This work reveals new and important insights into Britain’s development NGO sector, and illustrates the strength and contribution of new methods and more systematic analysis to advance what we know about such an important sector. Yet its findings also raise other important questions and topics for further research, including the ways different NGOs are responding to or working together to meet the changes and challenges we have identified, and the partnerships they may operate and collaborate with to try to improve funding or positioning in the sector. Funding (and power) inequalities inherent in the sector make this a particularly interesting question.
In addition, we need to know more about ‘the public’ that have driven such growth in recent years, despite the pressures on household incomes that have accompanied this giving and in the face of an increasingly hostile public narrative in some corners of the media. Who is this giving core, and how have they been able to increase giving in ever harder times? How affluent are they? Understanding who development NGOs’ ‘civic core’ is will be critical to development NGOs as individuals and as a collective; qualitative research into these issues across development NGOs of different sizes and positioning is critical.
While its recent history of growth suggests the sector has been enjoying good fortune, this positive story has also been accompanied by a rising anti-aid narrative, magnified in the press and public opinion by the Oxfam and Save the Children scandals in 2018. Understanding how growth has been managed is also of current concern in the wake of the these scandals, particularly whether and how organisations experiencing fast and strong growth can manage it in ways that keep them aligned with their core social mission and values. Discussions with NGO representatives also reveal that there is a strong sense that things have changed, and that clouds are looming on the horizon. Following these changes longitudinally, by maintaining databases like ours, and by constructing others similar to it, is now an important research challenge.
Cite this paper as:
Banks, Nicola and Brockington, Dan (2019) Mapping the UK’s development NGOs: income, geography and contributions to international development. GDI Working Paper 2019-035. Manchester: The University of Manchester.
Footnotes
- Our database does not include Northern Ireland because we could not easily obtain historical records from the Coalition of Development Agencies (CADA). Therefore ours is a study of development NGOs in Britain, not the United Kingdom.
- This is not a systematic review of academic research into NGOs more broadly (See Banks et al, 2015 for one recent attempt at this). Instead, it scans recent literature to see whether and how NGOs are conceptualised, analysed and studied at the sector level, as the sum of more than their parts. As such we do not consider other key academic research into NGOs, such as another broad literature looking at the management and organisational structure of NGOs (including issues of leadership) and how this may affect performance.
- Brockington and Scholfield’s work attempted to map all the conservation NGOs working in Sub-Saharan Africa.
- Source OECD. US$ figures were converted to Can$ for comparability. As of 1 June 2018, US$1 = Can$1.29.
- This is not a matter of a lack of interest or recognition. Hayman and Lewis (2017) recognise that there is growing interest in learning and exchanging ideas across international NGOs but, in practice, this is met with weak dissemination of experiences and gaps in the evidence base that could help in this, leaving little accessible knowledge in these areas. With regard to aid withdrawal, for example, international NGOs have found themselves in positions in which they were searching for knowledge and examples of ‘good’ and ‘bad’ exits, but this was elusive; few international NGOs were willing to share detailed examples when it came to ending partnerships, whether good or bad (Hayman and Lewis, 2017)
- BOND is a network of organisations working in international development that are based in Britain. See bond.org.uk for more details of its activities.
- Increased funding has not benefited all development NGOs, however. The largest organisations doubled their market share in government contracts, while NGOs with incomes under £2 million experienced declining income and market shares, to such an extent that the report questioned their survival (Kane et al, 2016).
- These lists remain in the public domain on our project website at: https://mappingdevelopmentngos.wordpress.com/excluded-organisations/.
- There is always a delay between the completion of a financial year and the submission of reports to the Charity Commission, which means that financial data on charities will be at least 18 months old.
- In this respect we differ from other reports which have used pre-determined financial years and allocated expenditure to them according to the last date of the NGO’s financial year. This is problematic because, if the pre-determined financial year runs from 1 April 2011 to 31 March 2012, then an organisation whose financial year ends on 1 May 2011 would have all its financial activity for that financial year allocated to the 2011–2012 year. The flaws of this approach are obvious.
- We controlled for inflation using deflators
- gdp-deflators-at-market-prices-and-money-gdp-june-2016-quarterly-national-accounts.
- We amalgamated the sources of income presented in the NCVO Almanac to present trends in the following list of sources: Business sector; Independent Government-funded Bodies (eg NHS trusts, universities, arts councils, public corporations); Investments; National Lottery; Non-profit sector (other NGOs and Foundations); Overseas Governments; The Public; UK Government (Central and Local); Unclassified.
- The sample size increases from 0.1% of the ‘micro-organisations’ (income less than £10 million) to include 87% of the ‘major organisations’ (income between £10 and £100 million).
- These follow the groupings in other reports (Kane et al, 2016; NCVO, 2016) except that we have split the category of >£1 million and <£10 million into two, following feedback from the sector. NGOs are allotted to size categories according to their average expenditure across 2009–2015.
- Aid Data is a research project at William and Mary College that collects, compiles and analyses data on foreign aid to help inform more evidence-based investments and policy making in sustainable development. Through rigorous methods their activities seek to answer the question: ‘Who is doing what, where for whom and to what effect?’This question, however, they apply only to bilateral and multilateral aid projects.
- Source OECD.
- We have explored whether increased giving in times of crisis is a response to major humanitarian crises. Peaks in giving coincide with years in which Disasters Emergency Committee (DEC) appeals took place, and there was no DEC appeal in 2012, the year when the largest NGOs saw a decline in their income. But we must highlight that any ‘DEC-effect’ on public donations is money collected over and above that donated directly to the DEC itself. DEC is a grant-making organisation and excluded from our database; money donated through it is reported as income sourced through ‘other charities’ rather than directly from the public as a result.
- Our database goes beyond this. It also collects information on operational priority, country(ies) of operation and networks, among other things.
References
AbouAssi, K. and Bowman, A.O. (2017). ‘Toward a conditional analysis of NGO–local government relations in developing countries’. Perspectives on Public Management and Governance
Alonso, J.A., Glennie, J. and Sumner, A. (2014). Recipients and Contributors: Middle-income Countries and the Future of Development Cooperation. Department of Social and Economic AffairsWorking Paper 135. (last accessed 25 January 2019).
Amagoh, F. (2015). ‘Improving the credibility and effectiveness of non-governmental organizations’. Progress in Development Studies 15, 221–239. Doi: 10.1177/1464993415578979.
Appe, S. (2017). ‘Directions in a post-aid world? South–South development cooperation and CSOs in Latin America’. VOLUNTAS: International Journal of Voluntary and Non-profit Organizations Doi: 10.1007/s11266-017-9838-0.
Appe, S., Barragan, D. and Telch, F. (2017). ‘Civil society vocabularies and signalling value: cases from Colombia and Ecuador’. Administrative Theory and Praxis 39, 100–121. Doi: 10.1080/10841806.2017.1309815.
Apthorpe, R. (2011). ‘Coda: Alice in Aidland, a seriously satirical allegory’. In Mosse, D. (ed.), Adventures in Aidland: The Anthropology of Professionals in International Development. (pp. 199–220). New York: Berghahn.
Archer, D. (2010). ‘The evolution of NGO–government relations in education: ActionAid 1972–2009’. Development in Practice 20, 611–618. Doi: 10.1080/09614521003763145.
Arhin, A. (2016). ‘Advancing post-2015 Sustainable Development Goals in a changing development landscape: challenges for NGOs in Ghana’. Development in Practice 26, 555–568. Doi: 10.1080/09614524.2016.1189513.
Arhin, A., Kumi, E. and Adam, M.A.S. (2018). ‘Facing the bullet: non-governmental organisations’ responses to the changing aid landscape in Ghana’. VOLUNTAS Doi: 10.1007/s11266-018-9966-1.
Atia, M. and Herrold, C.E. (2018). ‘Governing through patronage: the rise of NGOs and the fall of civil society in Palestine and Morocco’. VOLUNTAS Doi: 10.1007/s11266-018-9953-6.
Atkinson, A.B., Backus, P.G., Micklewright, J., Pharaoh, C. and Schnepf, S.V. (2012). ‘Charitable giving for overseas development: UK trends over a quarter century’. Journal of the Royal Statistical Society: Statistics in Society, Series A 175, 167–190. Doi: 10.1111/j.1467-985X.2011.01009.x.
Bachke, M.E., Alfnes, F. and Wik, M. (2014). ‘Eliciting donor preferences’. VOLUNTAS 25, 465–486. Doi: 10.1007/s11266-012-9347-0.
Banks, N., Hulme, D. and Edwards, M. (2015). ‘NGOs, states and donors revisited: still too close for comfort?’. World Development 66, 707–718. Doi: 10.1016/j.worlddev.2014.09.028.
Bano, M. (2018). ‘Partnerships and the good-governance agenda: improving service delivery through state–NGO collaborations’. VOLUNTAS Doi: 10.1007/s11266-017-9937-y.
Barr, A. and Fafchamps, M. (2006). ‘A client-community assessment of the NGO sector in Uganda’. Journal of Development Studies 42, 611–639. Doi: 10.1080/00220380600682009.
Bawole, J.N. and Hossain, F. (2015). ‘Marriage of the unwilling? The paradox of local government and NGO relations in Ghana’. VOLUNTAS 26, 2061–2083. Doi: 10.1007/s11266-014-9503-9.
Bebbington, A.J., Hickey, S. and Mitlin, D.C. (eds) (2008). Can NGOs make a Difference? The Challenge of Development Alternatives. London: Zed.
Bendell, J. (ed.) (2017). Terms for Endearment: Business, NGOs and Sustainable Development. London: Routledge.
Berghmans, M., Simons, M. and Vandenbeele, J. (2017). ‘What is negotiated in negotiated accountability? The case of INGOs’. VOLUNTAS 28, 1529–1561. Doi: 10.1007/s11266-016-9759-3.
Bernal, V. and Grewal, I. (eds) (2014). Theorizing NGOs: States, Feminisms, and Neoliberalism. Durham NC: Duke University Press.
Black, M. (1992). A Cause for our Times: Oxfam, the First 50 Years.Rugby, UK: Practical Action.
Brass, J. (2016). Allies or Adversaries? NGOs and the State in Africa.New York: Cambridge University Press.
Brass, J. (2012). ‘Why do NGOs go where they go? Evidence from Kenya’. World Development 40, 387–401.
Brockington, D. and Banks, N. (2017). ‘Changes in expenditure, income and income sources for development NGOs based in the UK’ [online project progress report available at https://mappingdevelopmentngos.wordpress.com/reports/].
Brockington, D. and Scholfield, K. (2010a). ‘Expenditure by conservation nongovernmental organisations in Sub-Saharan Africa’. Conservation Letters 3, 106–113. Doi: 10.1111/j.1755-263X.2010.00094.x.
Brockington, D. and Scholfield, K. (2010b). ‘The conservationist mode of production and conservation NGOs in Sub-Saharan Africa’. Antipode 42, 551–575. Doi: 10.1111/j.1467-8330.2010.00763.x.
Bukenya, B. (2017). ‘Are service-delivery NGOs building state capacity in the Global South? Experiences from HIV/AIDS programmes in rural Uganda’. Development Policy Review 36, O378–O399. Doi: 10.1111/dpr.12240.
Burger, R. and Owens, T. (2013). ‘Receive grants or perish? The survival prospects of Ugandan non-governmental organisations’. Journal of Development Studies 49, 1284–1298. Doi: 10.1080/00220388.2012.754430.
Christensen, D. and Weinstein, J.M. (2013). ‘Defunding dissent: restrictions on Aid to NGOs’. Journal of Democracy 24, 77–91. Doi: 10.1353/jod.2013.0026.
Clifford, D. (2016). ‘International charitable connections: the growth in number, and the countries of operation, of English and Welsh charities working overseas’. Journal of Social Policy 45, 453–486. Doi: 10.1017/S0047279416000076.
Cook, N.J., Wright, G.D. and Andersson, K.P. (2017). ‘Local politics of forest governance: why NGO support can reduce local government responsiveness’. World Development 92, 203–214. Doi: 10.1016/j.worlddev.2016.12.005.
Crewe, E. (2018). ‘Flagships and tumbleweed: a history of the politics of gender justice work in Oxfam GB 1986–2015’. Progress in Development Studies 18, 110–125. Doi: 10.1177/1464993417750286.
Dang, H., Knack, S. and Rogers, F.H. (2013). ‘International aid and financial crises in donor countries’. European Journal of Political Economy 32, 232–250.
Davis, J.M. (2018, in press). ‘Where do the real “non-governmental” development organisations go? Comparing poverty orientation between privately-financed and government-subsidised Canadian NGOs’. Canadian Journal of Development Studies.
Department for International Development (DfID) (2014). Statistics on International Development 2014 [online resource available at: https://www.gov.uk/government/statistics/statistics-on-international-development-2014].
Develtere, P. and de Bruyn, T. (2009). ‘The emergence of a fourth pillar in development aid’. Development in Practice 19, 912–922. Doi: 10.1080/09614520903122378.
Dodsworth, S. (2017). ‘How does the objective of aid affect its impact on accountability? Evidence from two aid programmes in Uganda’. Journal of Development Studies 53, 1600–1614. Doi: 10.1080/00220388.2016.1234039.
Drabek, A.G. (1987). ‘Development alternatives: the challenges for NGOs – an overview of the issues’. World Development 15, ix–xv.
Dupuy, K.E., Ron, J. and Prakash, A. (2015). ‘Who survived? Ethiopia’s regulatory crack-down on foreign-funded NGOs’. Review of International Political Economy 22, 419–456. Doi: 10.1080/09692290.2014.903854.
Dupuy, K.E. and Prakash, A. (2017). ‘Do donors reduce bilateral aid to countries with restrictive NGO laws? A panel study, 1993–2012’. Nonprofit and Voluntary Sector Quarterly 47, 89–106. Doi: 10.1177/0899764017737384.
Elbers, W. and Schulpen, L. (2015). ‘Reinventing international development NGOs: the case of ICCO’. European Journal of Development Research 27, 1–18. Doi: 10.1057/ejdr.2014.21.
Evans, M. (2018). ‘Whose problems? Whose solutions? The role of for-profit contractors as managers of British development challenge funds’. Masters Thesis, University of Amsterdam.
Fernandez-Aballi, A. (2016). ‘Advocacy for whom? Influence for what? Abuse of discursive power in international NGO online campaigns: the case of Amnesty International’. American Behavioral Scientist 60, 360–377. Doi: 10.1177/0002764215613407.
Footitt, H. (2017). ‘International aid and development: hearing multilingualism, learning from intercultural encounters in the history of OxfamGB’. Language and Intercultural Communication 17, 518–533. Doi: 10.1080/14708477.2017.1368207.
Fowler, A. (2016). ‘Non-governmental development organisations’ sustainability, partnership and resourcing: futuristic reflections on a problematic trialogue’. Development in Practice 26, 569–579. Doi:10.1080/09614524.2016.1188883.
Fruttero, A. and Gauri, V. (2005). ‘The strategic choices of NGOs: location decisions in rural Bangladesh’. Journal of Development Studies 41, 759–787. Doi: 10.1080/00220380500145289.
Gibelman, M. and Gelman, S.R. (2001). ‘Very public scandals: nongovernmental organizations in trouble’. VOLUNTAS 12, 49–66. Doi: 10.1023/A:1011242911726.
Gideon, J. and Porter, F. (2016). ‘Challenging gendered inequalities in global health: dilemmas for NGOs’. Development and Change 47, 782–797. Doi: 10.1111/dech.1224.
Goldman, M.J. and Little, J.S. (2015). ‘Innovative grassroots NGOs and the complex processes of women’s empowerment: an empirical investigation from Northern Tanzania’. World Development 66, 762–777. Doi: 10.1016/j.worlddev.2014.09.005.
Gulrajani, N. (2017). ‘Bilateral donors and the age of the national interest: what prospects for challenge by development agencies?’. World Development 96:375–389.
Hayman, R., and Lewis, S. (2017). ‘INTRAC’s experience of working with international NGOs on aid withdrawal and exit strategies from 2011 to 2016’. VOLUNTAS Doi: doi.org/10.1007/s11266-017-9901-x.
Heinrich, T., Kobayashi, Y. and Bryant, K.Y. (2016). ‘Public opinion and foreign aid cuts in economic crises’. World Development 77, 66–79. Doi: 10.1016/j.worlddev.2015.08.005.
Henson, S. and Lindstrom, S. (2013). ‘“A mile high and an inch deep?” Understanding public support for aid: the case of the United Kingdom’. World Development 42, 67–75.
Hielscher, S., Winkin, J., Crack, A. and Pies, I. (2017). ‘Saving the moral capital of NGOs: identifying one-sided and many-sided social dilemmas in NGO accountability’. VOLUNTAS 28, 1562–1594. Doi: 10.1007/s11266-016-9807-z.
Hulme, D. and Edwards, M. (1997). NGOs, States and Donors: Too Close for Comfort? London: Macmillan.
Hsu, J.Y.J, Hildebrandt, T. and Hasmath, R. (2016). ‘“Going out” or ”staying in”? The expansion of Chinese NGOs in Africa’. Development Policy Review 34, 423–439. Doi: 10.1111/dpr.12157.
Jalali, R. (2008). ‘International funding of NGOs in India: bringing the state back in’. VOLUNTAS 19, 161–188. Doi: 10.1007/s11266-008-9059-7.
Kane, D., MacKay, G. and Peach, K. (2016). ‘Financial trends for UK-based INGOs: an analysis of Bond members’ income between 2006/7 and 2013/14’. BOND Research Report [available at: https://www.bond.org.uk/sites/default/files/resource-documents/financial-trends-uk-ingos-0416.pdf].
Keating, V.C. and Thrandardottir, E. (2017). ‘NGOs, trust and the accountability agenda’. British Journal of Politics and International Relations 19, 134–151. Doi: 10.1177/1369148116682655.
Koch, D.J., Dreher, A. Nunnekamp, P. and Thiele, R. (2009). ‘Keeping a low profile: what determines allocation of aid by non-governmental organizations?’. World Development 37, 902–918. Doi: 10.1016/j.worlddev.2008.09.004.
Krawczyk, K. (2017). ‘The relationship between Liberian CSOs and international donor funding: boon or bane?’. VOLUNTAS Doi: 10.1007/s11266-017-9922-5.
Kumi, E. (2017). ‘Aid reduction and NGDOs quest for sustainability in Ghana: can philanthropic institutions serve as alternative resource mobilisation routes?’. VOLUNTAS Doi: 10.1007/s11266-017-9931-4.
Lewis, D. (2017). ‘Organising and representing the poor in a clientelistic democracy: the decline of radical NGOs in Bangladesh’. Journal of Development Studies 53, 1545–1567. Doi: 10.1080/00220388.2017.1279732.
Lewis, D. and Schuller, M. (2017). ‘Engagements with a productively unstable category: anthropologists and nongovernmental organizations’. Current Anthropology 58, 634–651. Doi: 10.1086/693897.
MacLean, L.M., Brass, J.N., Carley, S., El-Arini, A. and Breen, S. (2015). ‘Democracy and the distribution of NGOs promoting renewable energy in Africa’. Journal of Development Studies 51, 724–742. Doi: 10.1080/00220388.2014.989994.
Marburg, A., van Kranenburg, H. and Korzilius, H. (2016). ‘NGOs in the news: the road to taken-for-grantedness’. VOLUNTASDoi:10.1007/s11266-016-9757-5.
Mawdsley, E., Townsend, J.G. and Porter, G. (2005). ‘Trust, accountability and face-to-face interaction in North–South NGO relations’. Development in Practice 15, 77–82. Doi 10.1080/0961452052000321613.
Mohan, J. and Bulloch, S.L. (2012). The Idea of a ‘Civic Core’: What are the Overlaps between Charitable Giving, Volunteering, and Civic Participation in England and Wales? Third Sector Research Centre Working Paper 73, University of Birmingham.
Mutongwizo, T. (2017). ‘Comparing NGO resilience and “structures of opportunity” in South Africa and Zimbabwe (2010-2013)’. VOLUNTAS Doi:10.1007/s11266-017-9881-x.
NCVO (2016). Financial Sustainability Review: Change and Adaptation in the Voluntary Sector as the Economy Recovers.London:National Council for Voluntary Organisations.
Omona, J. and Mukuye, R. (2013). ‘Problems of credibility of NGOs in Uganda: implications for theory and practice’. VOLUNTAS 24, 311–334. Doi: 10.1007/s11266-011-9254-9.
Popplewell, R. (2018). ‘Civil society, legitimacy and political space: why some organisations are more vulnerable to restrictions than others in violent and divided contexts’. VOLUNTAS Doi:10.1007/s11266-018-9949-2.
Power, S.L. and Wanner, T.K. (2017). ‘Improving sanitation in the slums of Mumbai: an analysis of human rights-based approaches for NGOs’. Asian Studies Review 41, 209–226. Doi: 10.1080/10357823.2017.1298566.
Rainey, S., Wakunuma, K. and Stahl, B. (2016). ‘Civil society organisations in research: a literature-based typology’. VOLUNTAS 28, 1988–2010. Doi: 10.1007/s11266-016-9816-y.
Ronalds, P. (2010). The Change Imperative: Creating the Next Generation NGO. Sterling VA:Kumarian.
Sachedina, H. (2008). ‘Wildlife are our oil: conservation, livelihoods and NGOs in the Tarangire ecosystem, Tanzania’. D.Phil Thesis, University of Oxford.
Salamon, L.M and Sokolowski, S.W. (2017). ‘Beyond nonprofits: re-conceptualizing the third sector’. VOLUNTAS 27, 1515–1545. Doi: 10.1007/s11266-016-9726-z.
Salamon, L.M., Anheier, H.K., List, R., Toepler, S., Sokolowski, S.W. and Associates (1999). Global Civil Society: Dimensions of the Nonprofit Sector. Baltimore MD:John Hopkins Centre for Civil Society Studies.
Stanley, A. C., D. Willms, C. Schuster-Wallace and S. Watt (2017) ‘From rhetoric to reality: an NGO’s challenge for reaching the furthest behind’ Development in Practice 27(7): 913-926.
Stroup, S.S. and Wong, W.H. (2017). The Authority Trap: Strategic Choices of International NGOs. New York:Cornell University Press.
Suarez, D. and Gugerty, M.K. (2016). ‘Funding civil society? Bilateral government support for development NGOs’. VOLUNTAS 27, 2617–2640. Doi: 10.1007/s11266-016-9706-3.
Tierney, M.J., Nielson, D.L., Hawkins, D.G., Roberts, J.T., Findlay, M.G., Powers, R.M., Parks, B., Wilson, S.E. and Hicks, R.L. (2011). ‘More dollars than sense: refining our knowledge of development finance using AidData’. World Development 39, 1891–1906. Doi: 10.1016/j.worlddev.2011.07.029.
Urquia-Grande, E., Rautiainen, A. and Perez-Estebanez, R. (2017). ‘The effectiveness of rural versus urban non-profit organisations in the Democratic Republic of Congo’. Third World Quarterly 38, 2129–2142. Doi: 10.1080/01436597.2017.1322464.
Vallejo, B. and Wehn, U. (2016). ‘Capacity development evaluation: the challenge of the results agenda and measuring return on investment in the Global South’. World Development 79, 1–13. Doi: 10.1016/j.worlddev.2015.10.044.
Walton, O., Davies, T., Thrandardottir, E. and Keating, V.C. (2016). ‘Understanding contemporary challenges to INGO legitimacy: integrating top-down and bottom-up perspectives’. VOLUNTAS 27, 2764–2786.
Wood, J. (2016). ‘Unintended consequences: DAC governments and shrinking civil society space in Kenya’. Development in Practice 26, 532–543. Doi: 10.1080/09614524.2016.1188882.
Studies, Vol. 45(8), pp. 1360-1380.
Acknowledgements
This project has received funding from the Economics and Social Research Council under grant reference number ES/K009729/1.